Maths


This week we have been busy learning and using mathematical terms.
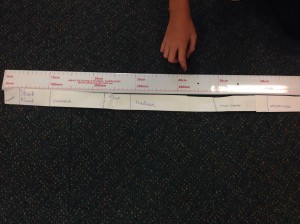
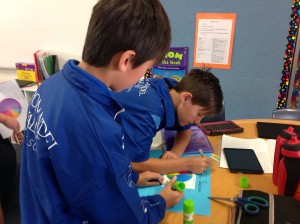
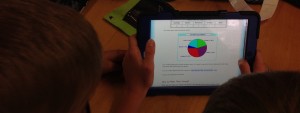
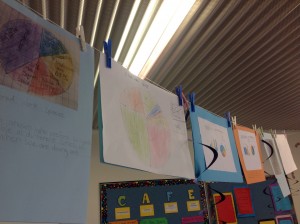
We have also used our devices to inquire into the different methods of making a pie graph. This began from our action research into work spaces. Following Michael Ymer’s idea of making a strip graph of percentages using a metre ruler as a guide, we picked up the strip graph and turned it into a circle. This resulted in a rudimentary pie graph. Students had a go at making this, but many were unhappy with the approximation of a pie graph and wanted to find out how to make it more accurate. They researched how to make a digital pie graph, some researched how to do it manually and some requested that I run a ‘clinic’ on how to make one manually. All were successful in their own way and felt a sense of achievement.
This was really good as it provided multiple entry points for students and encouraged some to really stretch their thinking and develop deeper understanding.